* My only connection with Living DNA, or any other DNA testing company, is as a customer. I have received no concessions, free gifts or financial inducements from any of them. I receive no benefits should you decide to purchase their tests.
In the light of the recent ethnicity updates from Living DNA, the perceived accuracy of these estimates has again been the subject of heated debate. Personally, regarding the Living DNA update, I am very pleased with the strong correlation between the documentary trees and the ethnicity estimates of the three kits that I am involved with. This may be because we all have, as far as we know, 100% British ancestry within the genealogical time-frame. Inevitably, amidst the excitement and praise, the updates have brought out plenty of ‘my results are wrong, this company is rubbish’ comments. Indeed, I too have looked at the ‘accuracy’ of the estimates (and used the word rubbish about previous results – although I did qualify it!).
I am a long way from being any kind of DNA expert but many of the main complainants seem to be missing a number of points. Firstly, these are estimates, it is an emerging science, we are a long way away from ethnicity profiles being a complete reflection of our ancestral origins. They will become more accurate over time but the results are currently only as accurate as the base populations from which they are derived. They are more accurate for some areas than others. In Living DNA’s case, it seems that those with British ancestry are more likely to find that their results are a better reflection of the documentary evidence, than those whose families originate elsewhere.
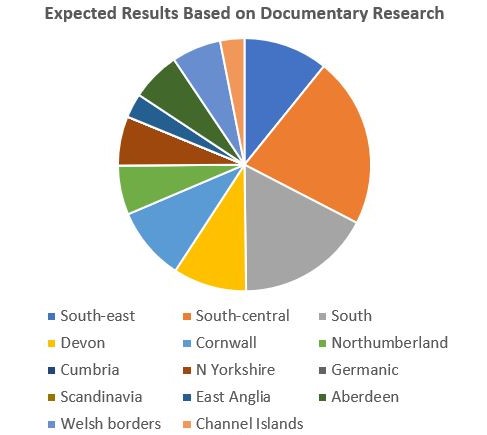
The crucial issue here is how we are measuring ‘accuracy’? Are we looking at where our grandparents were born? Our great grandparents? Their parents? In a British context, having talked to a number of family historians, it seems that you have to go back to those born about 1770-1800 (for me that is 3 x great-grandparents) before you stop adding additional birth counties (N.B. that is counties not countries) to your make-up. Here is an example:- My parents were born in two adjacent counties, Surrey and Middlesex. This does not reflect my earlier origins very well. If I go back to my grandparents, they were born in Surrey, Middlesex (x 2) and Cornwall, so I have added a county. Great grandparents adds Northumberland, Essex and Buckinghamshire to the mix of birthplaces. The next generation adds Sussex and Norfolk. The birthplaces of my 3 x great grandparents looks like the map below and beyond that only those counties illustrated feature. If I were able to go back beyond the genealogical time-frame (earlier than 1500) my deeper ancestry will be more diverse. Anyone with a British family trees will ultimately descend from those with origins in Europe (Saxons, Normans, Vikings, etc.) and beyond but it is unlikely that these individuals will ever appear on our documentary family trees.
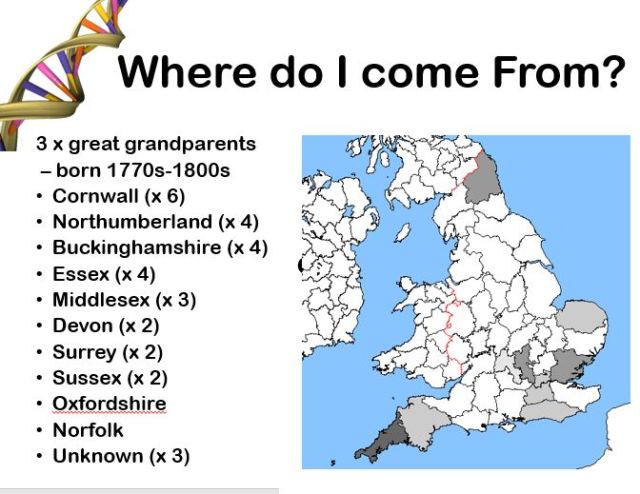
Map created using Genmap
If you are non-British, there will be different considerations of course. Even for those whose ancestry is British, migration patterns cannot be ignored. For example, many who have Northern Irish ancestry in 1800 will find that these families came originally from Scotland or England. We may not know that because we are unable to trace our lines back that far but that may be what the DNA will reflect.
This is not all of course. We all assume that our documentary tree is genetically correct in every particular. It won’t be. Somewhere along one line or another, our solidly Yorkshire great-grandad won’t actually be the father of grandma. Great-grandma will have had a liaison with someone from Kent, or Germany, or Kazakhstan and we will never know, unless DNA matches give us a clue. Our only measure of accuracy is the tree we have lovingly researched and it is gratifying when our ethnicity estimate suggests we have got it right but it is not the company’s fault if we have got it wrong.
On the subject of updates, for my kits, the final Living DNA update is in and I should comment on that, as I have on the others. This person has ancestry from a very restricted geographical area (I promised not to use the word in-bred). So much so, that his sample formed part of the base data to identify Devon DNA. Going back to the ‘magic’ 1770-1800 mark (3 x great grandparents), 88% of his ancestry comes from within fifteen miles of his own birthplace and covers just two adjacent registration districts in north-west Devon. The other 12% is from Cornwall.
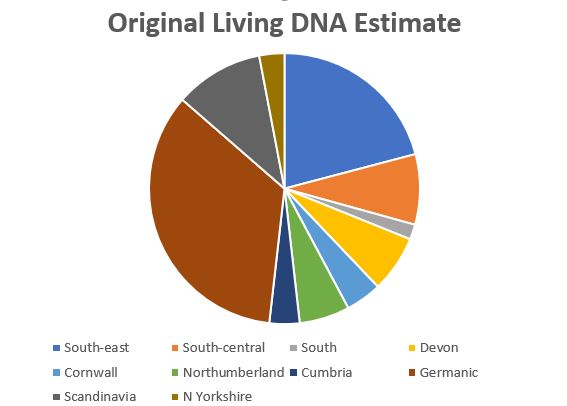
The original results were more diverse than this implies:
Devon 48.6%
Cornwall 24.5%
South-east England 13.8%
South England 7%
Cumbria 2.4%
Ireland 2%
South central England 1.6%
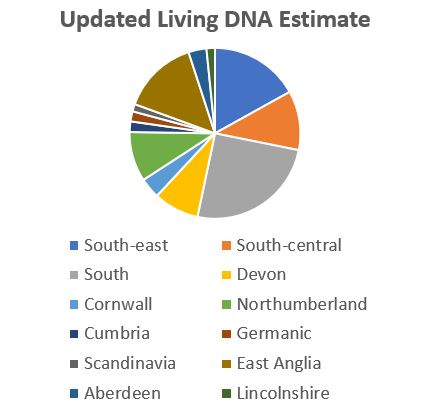
The new results reflect the documentary tree more closely:
Devon 64%
Cornwall 22.5%
South England 4%
Ireland 2.4%
South Central England 2.4%
South Wales Border 1.9%
Cumbria 1.7%
South-east England 1%
Now, anything other than the south-west appears to be just ‘noise’.
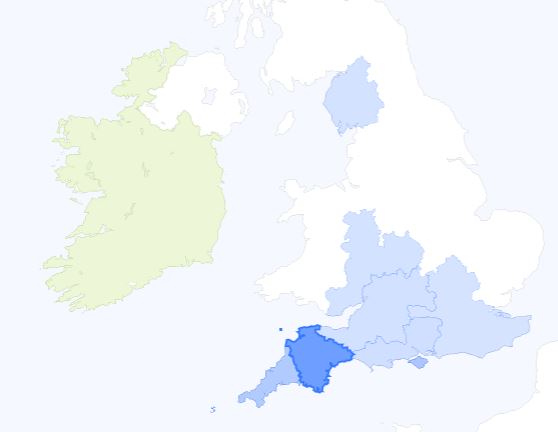
Map from Living DNA
Nothing to do with DNA but I know there are readers who are waiting for hint about my next historical novel. I have already said that it is, like Barefoot on the Cobbles, based on a true story. It is also, again like Barefoot, rooted in rigorous genealogical research. Oh and it does now have a title but I will be revealing that at a later date.