So today the second set of DNA results that I look after at Living DNA have received their update. These are Martha’s ethnicity estimate. Although I was very pleased with my own initial Living DNA results and their close resemblance to my documentary tree, Martha’s original results were, not to put too fine a point on it, pretty rubbish. Here are the comments that I made at the time. I do appreciate that our documentary trees do not always mirror our genetic trees and that ethnicity estimates are just that but Martha’s original results had us wondering if she had been swapped at birth, or, less dramatically, if she had been given someone else’s results altogether. As she matched both me and her maternal aunt, it seemed that neither scenario was the case.
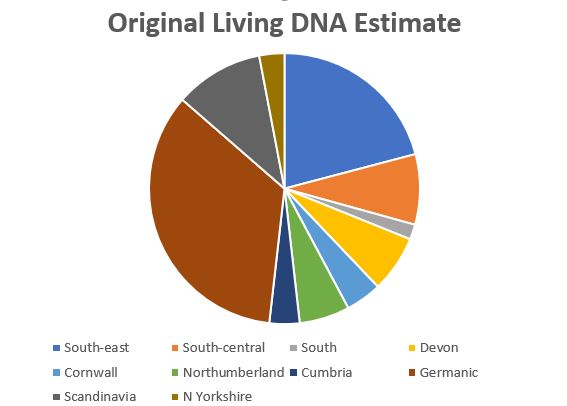
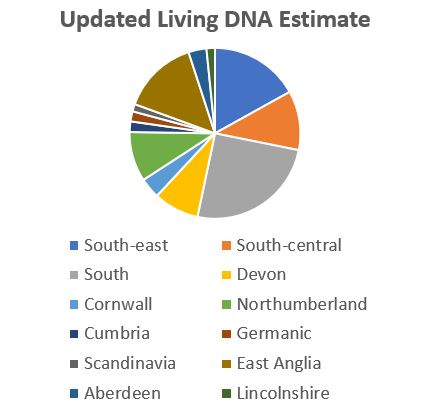
It was a lovely surprise therefore to find that the updated results were much closer to what forty years worth of documentary research might have led me to expect. Previously, 45% of Martha’s DNA was designated to be Germanic or Scandinavian. Migrations from Europe to the east coast notwithstanding, this was a ridiculously high amount. This has now diminished to a much more likely 3.3%. Last time there was no trace of her paternal Scottish ancestry, a significant proportion from the Forest of Dean, her Welsh borders roots, or the small amount from the Channel Islands. Now, the Forest of Dean shows up, as does Aberdeenshire, although there is still no sign of Worcestershire, which is included in the Welsh borders region. What is notable is the complete lack of Yorkshire ancestry this time. I have 6.7% from Yorkshire in my revised estimate and I have not yet found any ancestors from Yorkshire. Martha, on the other hand, who now has zero Yorkshire DNA, has a Yorkshire great great grandparent.
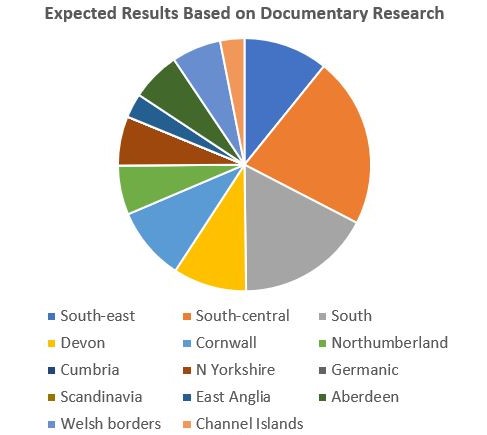
So then how close is Martha’s new estimate to what I might expect? As I did for my results yesterday, let’s look at this one region at a time.
Devon and Cornwall first. If Martha had inherited equally from all her 3 x great grandparents (which I know she will not have), her profile should show 9.4% each from both Devon and Cornwall. Last time, this was slightly under represented with 6.8% from Devon and 4.3% from Cornwall. The new results reveal similar amounts: 8.6% for Devon and 3.9% for Cornwall. This swing from Cornwall to Devon, small in Martha’s case, is more marked in my revised estimate.
Northumberland was about right last time at 6%. This has increased to 9.4%. Scotland now appears with 3.4%, as opposed to an anticipated 6.3%. Taken together, these regions are as expected.
The south and south-east of the country is where the highest percentages lie, according to the documentary evidence, with 53% having origins in these regions. Last time, only 30% showed up but now it is a much more realistic 68%. It is difficult to comment on the distribution between the south, south-central, south-eastern and east Anglia regions, partly because Living DNA include Essex in both the south-east and East Anglia.
So the verdict so far, with two out of three updates in, mine has gone from good to still good and Martha’s, has gone from poor to good. Overall, I am very satisfied. Let us see what the third update will bring.
