Scouting for Boys – and Girls

Warning: Proud Granny elements in this post but mostly family history.

This month has seen not one but two of my descendants continue the family tradition of involvement with the Scouting/Guiding movement. Both Edward and Lucy have been invested as Beavers. This occasion is significant for both of them but for Edward it also marks a step forward in his ability to work in a group setting – more of that on BeingEdward at a later date. They are the fourth generation to be involved in scouting. Edward’s mum was a Rainbow, a Brownie a Guide and a Brownie leader. She is now ‘Rabbit’ (all the adults are named after Winnie the Pooh characters) for Edward’s Beaver Colony. Lucy’s mum was a Brownie (Rainbows hadn’t been invented then) a Guide, earning the Baden-Powell Award and a young leader. I was, briefly, a Brownie and then an enthusiastic Guide before a spell as Tawny Owl.

Other family members have also been involved. Lucy and Edward’s maternal grandfather was a Cub and a Queen’s Scout. His father, their great-grandfather, was also  a Scout leader. It isn’t just their maternal ancestors who have been involved in scouting. There have been Beavers, Cubs, Scouts, Guides and Cub leaders amongst their paternal ancestors too.

I was trying to put together photographic evidence of this and discovered that I only have one photograph documenting my five years as a guide and this is blurry as it is taken from a slide. I do have a few pictures of others at camps but not of me. It just shows how easily a significant part of one’s past can disappear from the family record. My time as a Brownie and a Brownie leader are merely the stuff of memory, although somewhere in the loft I do have my brownie promise card. Our badges do survive and now adorn blankets. I have my guide handbook and a 1948 edition of Scouting for Boys, which must have belonged to my late father-in-law. It is exciting to see these traditions pass to a new generation.


So Your DNA Results are ‘Wrong’

* My only connection with Living DNA, or any other DNA testing company, is as a customer. I have received no concessions, free gifts or financial inducements from any of them. I receive no benefits should you decide to purchase their tests.

In the light of the recent ethnicity updates from Living DNA, the perceived accuracy of these estimates has again been the subject of heated debate. Personally, regarding the Living DNA update, I am very pleased with the strong correlation between the documentary trees and the ethnicity estimates of the three kits that I am involved with. This may be because we all have, as far as we know, 100% British ancestry within the genealogical time-frame. Inevitably, amidst the excitement and praise, the updates have brought out plenty of ‘my results are wrong, this company is rubbish’ comments. Indeed, I too have looked at the ‘accuracy’ of the estimates (and used the word rubbish about previous results – although I did qualify it!).

I am a long way from being any kind of DNA expert but many of the main complainants seem to be missing a number of points. Firstly, these are estimates, it is an emerging science, we are a long way away from ethnicity profiles being a complete reflection of our ancestral origins. They will become more accurate over time but the results are currently only as accurate as the base populations from which they are derived. They are more accurate for some areas than others. In Living DNA’s case, it seems that those with British ancestry are more likely to find that their results are a better reflection of the documentary evidence, than those whose families originate elsewhere.

The crucial issue here is how we are measuring ‘accuracy’? Are we looking at where our grandparents were born? Our great grandparents? Their parents? In a British context, having talked to a number of family historians, it seems that you have to go back to those born about 1770-1800 (for me that is 3 x great-grandparents) before you stop adding additional birth counties (N.B. that is counties not countries) to your make-up. Here is an example:- My parents were born in two adjacent counties, Surrey and Middlesex. This does not reflect my earlier origins very well. If I go back to my grandparents, they were born in Surrey, Middlesex (x 2) and Cornwall, so I have added a county. Great grandparents adds Northumberland, Essex and Buckinghamshire to the mix of birthplaces. The next generation adds Sussex and Norfolk. The birthplaces of my 3 x great grandparents looks like the map below and beyond that only those counties illustrated feature. If I were able to go back beyond the genealogical time-frame (earlier than 1500) my deeper ancestry will be more diverse. Anyone with a British family trees will ultimately descend from those with origins in Europe (Saxons, Normans, Vikings, etc.) and beyond but it is unlikely that these individuals will ever appear on our documentary family trees.

Capture

Map created using Genmap

If you are non-British, there will be different considerations of course. Even for those whose ancestry is British, migration patterns cannot be ignored. For example, many who have Northern Irish ancestry in 1800 will find that these families came originally from Scotland or England. We may not know that because we are unable to trace our lines back that far but that may be what the DNA will reflect.

This is not all of course. We all assume that our documentary tree is genetically correct in every particular. It won’t be. Somewhere along one line or another, our solidly Yorkshire great-grandad won’t actually be the father of grandma. Great-grandma will have had a liaison with someone from Kent, or Germany, or Kazakhstan and we will never know, unless DNA matches give us a clue. Our only measure of accuracy is the tree we have lovingly researched and it is gratifying when our ethnicity estimate suggests we have got it right but it is not the company’s fault if we have got it wrong.

On the subject of updates, for my kits, the final Living DNA update is in and I should comment on that, as I have on the others. This person has ancestry from a very restricted geographical area (I promised not to use the word in-bred). So much so, that his sample formed part of the base data to identify Devon DNA. Going back to the ‘magic’ 1770-1800 mark (3 x great grandparents), 88% of his ancestry comes from within fifteen miles of his own birthplace and covers just two adjacent registration districts in north-west Devon. The other 12% is from Cornwall.

The original results were more diverse than this implies:

Devon 48.6%

Cornwall 24.5%

South-east England 13.8%

South England 7%

Cumbria 2.4%

Ireland 2%

South central England 1.6%

The new results reflect the documentary tree more closely:

Devon 64%

Cornwall 22.5%

South England 4%

Ireland 2.4%

South Central England 2.4%

South Wales Border 1.9%

Cumbria 1.7%

South-east England 1%

Now, anything other than the south-west appears to be just ‘noise’.

Capture

Map from Living DNA

Nothing to do with DNA but I know there are readers who are waiting for hint about my next historical novel. I have already said that it is, like Barefoot on the Cobbles, based on a true story. It is also, again like Barefoot, rooted in rigorous genealogical research. Oh and it does now have a title but I will be revealing that at a later date.

Another Day, Another Set of Living DNA Results

So today the second set of DNA results that I look after at Living DNA have received their update. These are Martha’s ethnicity estimate. Although I was very pleased with my own initial Living DNA results and their close resemblance to my documentary tree, Martha’s original results were, not to put too fine a point on it, pretty rubbish. Here are the comments that I made at the time. I do appreciate that our documentary trees do not always mirror our genetic trees and that ethnicity estimates are just that but Martha’s original results had us wondering if she had been swapped at birth, or, less dramatically, if she had been given someone else’s results altogether. As she matched both me and her maternal aunt, it seemed that neither scenario was the case.

Martha original Living DNA estimate

Martha expected results

It was a lovely surprise therefore to find that the updated results were much closer to what forty years worth of documentary research might have led me to expect. Previously, 45% of Martha’s DNA was designated to be Germanic or Scandinavian. Migrations from Europe to the east coast notwithstanding, this was a ridiculously high amount. This has now diminished to a much more likely 3.3%. Last time there was no trace of her paternal Scottish ancestry, a significant proportion from the Forest of Dean, her Welsh borders roots, or the small amount from the Channel Islands. Now, the Forest of Dean shows up, as does Aberdeenshire, although there is still no sign of Worcestershire, which is included in the Welsh borders region. What is notable is the complete lack of Yorkshire ancestry this time. I have 6.7% from Yorkshire in my revised estimate and I have not yet found any ancestors from Yorkshire. Martha, on the other hand, who now has zero Yorkshire DNA, has a Yorkshire great great grandparent.

Martha Feb 2020 Living DNA estimate

So then how close is Martha’s new estimate to what I might expect? As I did for my results yesterday, let’s look at this one region at a time.

Devon and Cornwall first. If Martha had inherited equally from all her 3 x great grandparents (which I know she will not have), her profile should show 9.4% each from both Devon and Cornwall. Last time, this was slightly under represented with 6.8% from Devon and 4.3% from Cornwall. The new results reveal similar amounts: 8.6% for Devon and 3.9% for Cornwall. This swing from Cornwall to Devon, small in Martha’s case, is more marked in my revised estimate.

Northumberland was about right last time at 6%. This has increased to 9.4%. Scotland now appears with 3.4%, as opposed to an anticipated 6.3%. Taken together, these regions are as expected.

The south and south-east of the country is where the highest percentages lie, according to the documentary evidence, with 53% having origins in these regions. Last time, only 30% showed up but now it is a much more realistic 68%. It is difficult to comment on the distribution between the south, south-central, south-eastern and east Anglia regions, partly because Living DNA include Essex in both the south-east and East Anglia.

So the verdict so far, with two out of three updates in, mine has gone from good to still good and  Martha’s, has gone from poor to good. Overall, I am very satisfied. Let us see what the third update will bring.

New DNA Results from Living DNA – some thoughts

Well, that was exciting. My updated ethnicity estimate from Living DNA is in. My original results, which I received in June 2017, were a pretty fair reflection of my  what I expected, based on my documentary tree. Compared to my estimates from other companies, it was the closest match to what I have discovered during over forty years of research. Here is what I wrote at the time, some of which I have repeated here.

Today’s revised estimate is based on Living DNA’s improved, more refined data. There are no massive changes but it is interesting to examine the subtle differences and how the new results compare to my predictions, based on the paper trail.

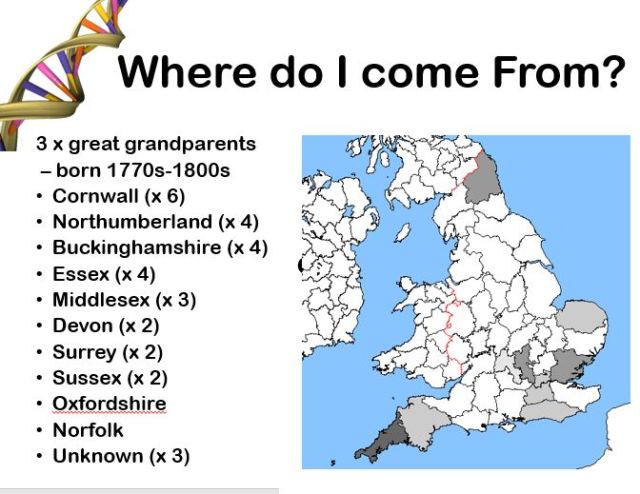
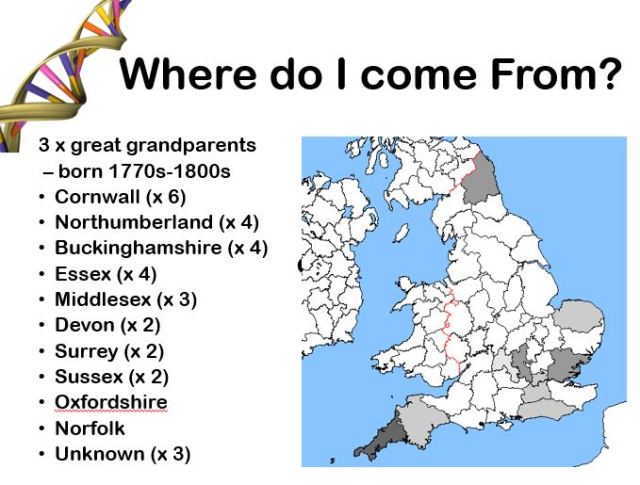
I am now in my fifth decade of family history research and have an extensive pedigree based on documentary research. I am fortunate to know the geographical origins of 31 of my 32 3 x great grand-parents and 75% of the generation before that. This takes me back to the mid-eighteenth century, well before the point at which my ancestors converged on Greater London. Of course, these estimates are just that, ESTIMATES but as the science improves, we might expect that they will become more accurate.

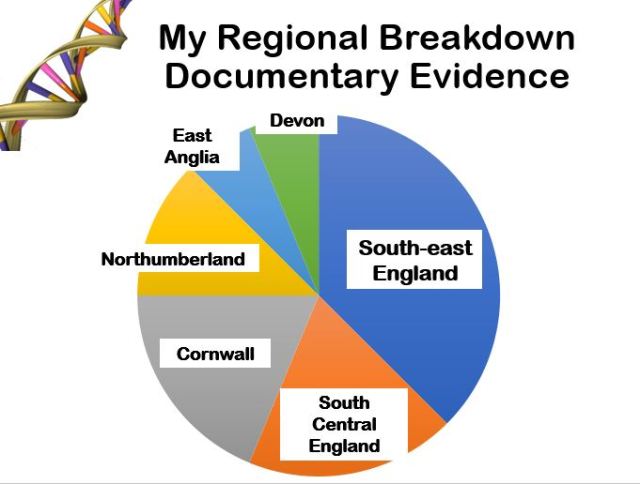
In preparation for the original results, I used my research to work out what I might expect. I am aware that the DNA that I have inherited does not come equally from all my 3 x great-grandparents and that some of them may have left no trace in my profile but I had no way of taking account of this. I am also assuming that my documentary pedigree is correct. Matches at other testing companies have, so far, not given me any reason to think that my genetic tree is different from my paper one. Based on my knowledge, my expectation was that my genetic make-up would reveal:-
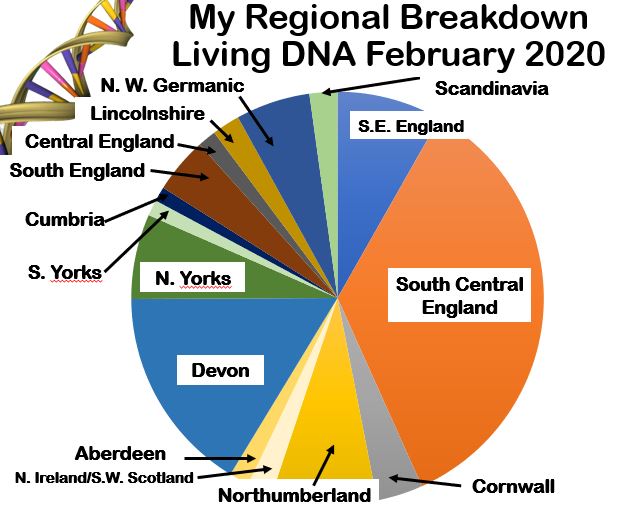
Cornwall 20%

Devon 5%

Northumberland 12.5%

South Eastern England 37.5%

South Central England 19%

East Anglia 6%

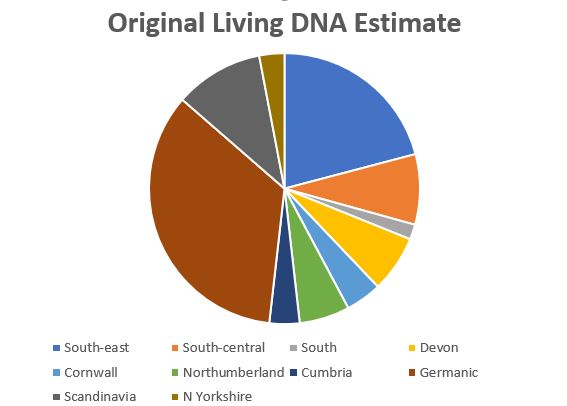
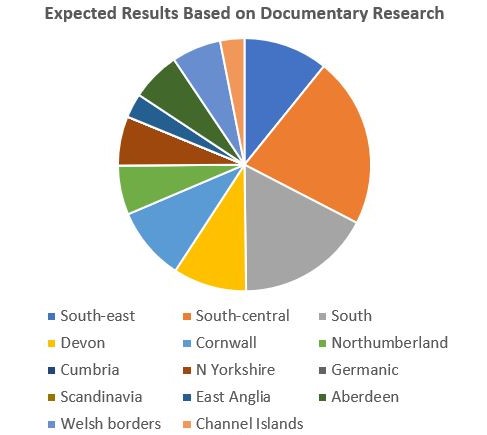
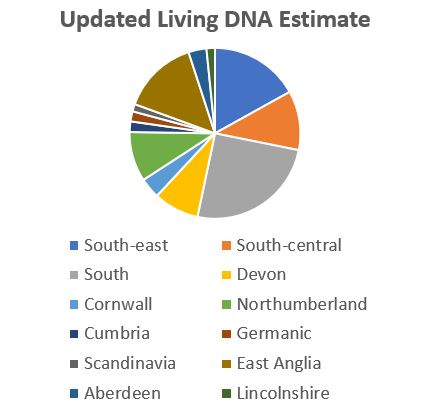
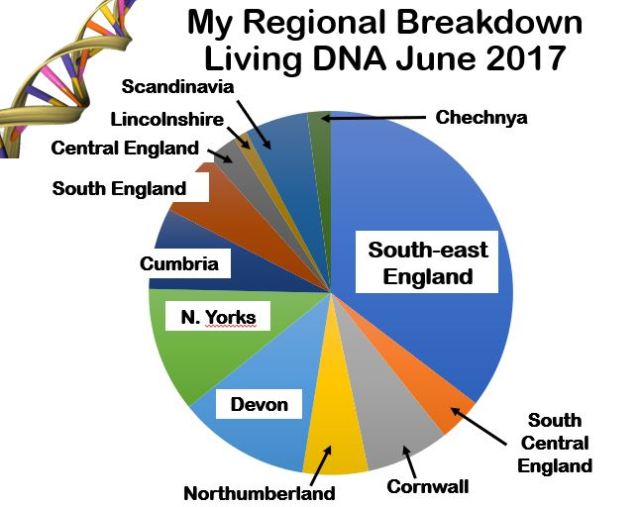
So, as I did with the first results, let us examine a region at a time. Firstly the south-west, Devon and Cornwall. By my reckoning, the south-west makes up 25% of my ancestry, with 20% being Cornish and 5% for Devon. Living DNA’s first percentages were 7.4% Cornish and 11.7% from Devon. Now, the overall percentage is the same – 19.1% but the distinction between Devon and Cornwall has become less accurate, rather than more, with 3.5% Cornish and 15.6% now being allocated to Devon. As my south-west ancestors lived very close to the Devon-Cornwall border, on one side or another, I am not disappointed with this.

Next, Northumberland, which I would expect to be 12.5% of my ancestry. With the original results, by adding the estimates for Northumberland (5.8%) and Cumberland (7.2%), I had the anticipated 13%. This segment of my ancestry has now been refined to be slightly more accurate, with 7.9% for Northumberland, 1.1% for the North-west, 1.9% N.Ireland/S.W. Scotland and 1.5% Aberdeenshire, a total of 12.4%. I suspect that the lost 0.6% has defected to Europe.

In the south-east, again the more refined breakdowns have become less similar to the documentary tree. I believe that the bulk of my ancestors, 37.5%, come from the south-east, Essex and Sussex. Last time, Living DNA agreed, with 35.3%. Now, the new results show only 7.9% of my make-up being from the south-east. I would anticipate a further 19% to come from the south-central region. This was under-represented first time round, at only 3.9%. The swing to the south-central region has been huge; I now have 33.7% from there. Living DNA has also made minor adjustments to the percentages from the south, which has moved from 5.8% to 4.2% and to the central region, which has gone from 2.7% to 1.4%. So once again, I find that the percentage for the general area is what I would expect but the distribution within that area has become slightly less accurate.

So what does that leave? There is still no sign of my expected 6% East Anglian ancestry. As I commented last time, I suspect that that has become Scandinavian ancestry, which has decreased from 5.6% to 4%. Lincolnshire has increased from 1.2% to 2.1%. I have lost the anomalous 2.1% from Chechnya and gained 7.5% from north-west Germany, perhaps reflecting early migrations to the east coast.

What fascinated me last time and still does, is the alleged Yorkshire ancestry, which has decreased slightly, going from 11.1% for North Yorkshire, to 6.4% for North Yorkshire and 1.2% for South Yorkshire.  At present, I have one great, great grandmother whose origins are unknown but my best guess would be the Shropshire/Worcestershire borders. Should I be looking at Yorkshire instead, or might this be the DNA manifestation of Shropshire/Worcestershire?

I also have a 4 x great grandmother who appears on my tree in that position 3 times, due to the marriage of cousins in two successive generations, thus she represents 4.7% of my ancestry. I do not know her surname and I have no idea of her origins. At present, I have assumed she was from the south-east, which is where her children were born in the 1780s; I wonder if I may be wrong.

So, overall, I still find that Living DNA’s regional breakdown is broadly similar to my documentary tree. The minor tweaks that have come with new results have been a case of win some lose some. Overall though, I am pleased with Living DNA. I am still waiting for the updates on two other kits, so I will be reporting back further then. I am especially interested to see if the one which diverges dramatically from the paper trail has changed.

Capture

Map created using Genmap

Capture

Capture


Living DNA February 2020

* My only connection with Living DNA, or any other DNA testing company, is as a customer. I have received no concessions, free gifts or financial inducements from any of them.